Graphing Linear Inequalities
This is a graph of a linear inequality:
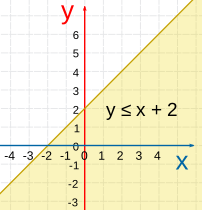
The inequality y ≤ x + 2
We can see the y = x + 2 line, and the shaded area is where y is less than or equal to x + 2
Linear Inequality
A Linear Inequality is like a Linear Equation (such as y = 2x+1) ...
... but it will have an Inequality like <, >, ≤, or ≥ instead of an =.
How to Graph a Linear Inequality
Graph the "equals" line, then shade in the correct area.
Follow these steps:
- Rearrange the equation so "y" is on the left and everything else on the right
- Remember to flip the inequality sign if we multiply or divide by a negative number while rearranging
- Plot the y= line, make it a solid line for y≤ or y≥, and a dashed line for y< or y>
- Shade above the line for a "greater than" (y> or y≥)
or below the line for a "less than" (y< or y≤).
Let's try some examples:
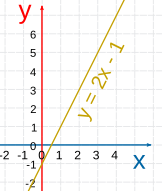
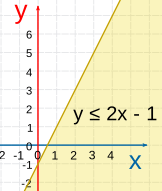
Example: y ≤ 2x−1
1. The inequality already has "y" on the left and everything else on the right, so no need to rearrange.
2. Plot y = 2x−1 (as a solid line because y≤ includes equal to):
3. Shade the area below (because y is less than or equal to):
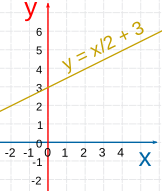
Example: 2y − x ≤ 6
1. We'll need to rearrange this one so "y" is on its own on the left:
2. Now plot y = x2 + 3 (as a solid line because y≤ includes equal to):
3. Shade the area below (because y is less than or equal to):
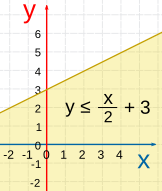
Example: 4 − 2y ≤ 2x
1. Rearrange so "y" is on its own on the left:
2. Plot y = −x + 2 as a solid line.
3. Shade above the line (because y is greater than or equal to).
Example: y/2 + 2 > x
1. We'll need to rearrange this one so "y" is on its own on the left:
2. Now plot y = 2x − 4 (as a dashed line because y> doesn't include equals to):
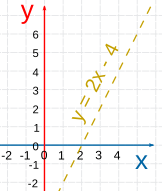
3. Shade the area above (because y is greater than):
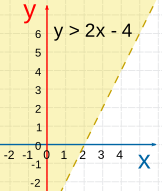
The dashed line shows that the inequality does not include the line y = 2x−4.
Also try the Inequality Grapher.
Check With a Point
We can check if we shaded the right side by picking a point (like 0,0) and seeing if it works in the inequality.
In our last example y > 2x − 4:
That's True! So (0,0) should be in the shaded area. Looking at the graph, it is!
Tip: If the line passes directly through (0,0), pick any other point not on the line, such as (0,1) or (1,1).
Two Special Cases
We can also have a horizontal, or vertical, line:
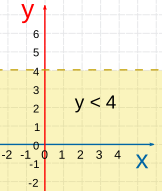
This shows where y is less than 4
(from, but not including, the line y=4 on down)
Notice we have a dashed line to show it does not include y=4
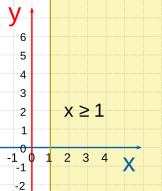
This one doesn't even have y in it!
It has the line x=1, and is shaded for all values of x greater than (or equal to) 1
Tip: For inequalities like x ≥ 1 we shade right of the vertical line. For x ≤ 1 we shade left.