Box and Whisker Plots
This is a Box and Whisker Plot:
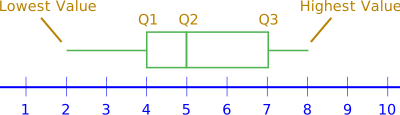
The "box" shows the middle 50% of the data, and the "whiskers" extend out to the minimum and maximum values.
Quartiles
To build a plot we use the idea of quartiles: Q1, Q2 and Q3 are the values that divide a list of numbers into quarters.
Example: 5, 7, 4, 4, 6, 2, 8
Sorted: 2, 4, 4, 5, 6, 7, 8
Q2 (the median) is in the middle:
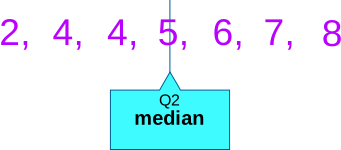
Median (Q2) = 5
Halve the lower and upper parts:
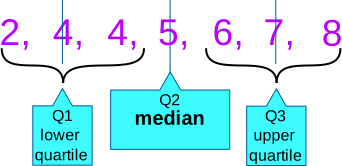
- Quartile 1 (Q1) = 4
- Quartile 2 (Q2) = 5
- Quartile 3 (Q3) = 7
With those values, and the lowest and highest value we can build a Box and Whisker Plot.
How to Build a Box Plot
Follow these steps:
- Put the numbers in order
- Find the Lowest Value (Minimum) and Highest Value (Maximum)
- Find the Median (Quartile 2, Q2)
- Find Quartile 1 (Q1), the median of the lower half
- Find Quartile 3 (Q3), the median of the upper half
- Draw a line for the scale, put a box from Q1 to Q3, a vertical line at Q2, and draw whiskers to the Minimum and Maximum
Step-by-Step Example
Example: Create a Box and Whisker Plot for
4, 17, 7, 14, 18, 12, 3, 16, 10, 4, 4, 11
Step 1: Put them in order
3, 4, 4, 4, 7, 10, 11, 12, 14, 16, 17, 18
Step 2: Find Minimum and Maximum
- Lowest Value (Minimum) = 3
- Highest Value (Maximum) = 18
Step 3: Find the Median (Q2)
The median is right between 10 and 11:
3, 4, 4, 4, 7, 10 | 11, 12, 14, 16, 17, 18
Q2 = 10 + 112 = 10.5
Step 4: Find Q1 and Q3
3, 4, 4 | 4, 7, 10 (10.5) 11, 12, 14 | 16, 17, 18
- Quartile 1 (Q1) = (4+4)/2 = 4
- Quartile 3 (Q3) = (14+16)/2 = 15
Step 5: Draw the Box Plot

Note: Quartiles can be calculated in different ways (including or excluding the median). If your app gives a slightly different answer, don't worry.